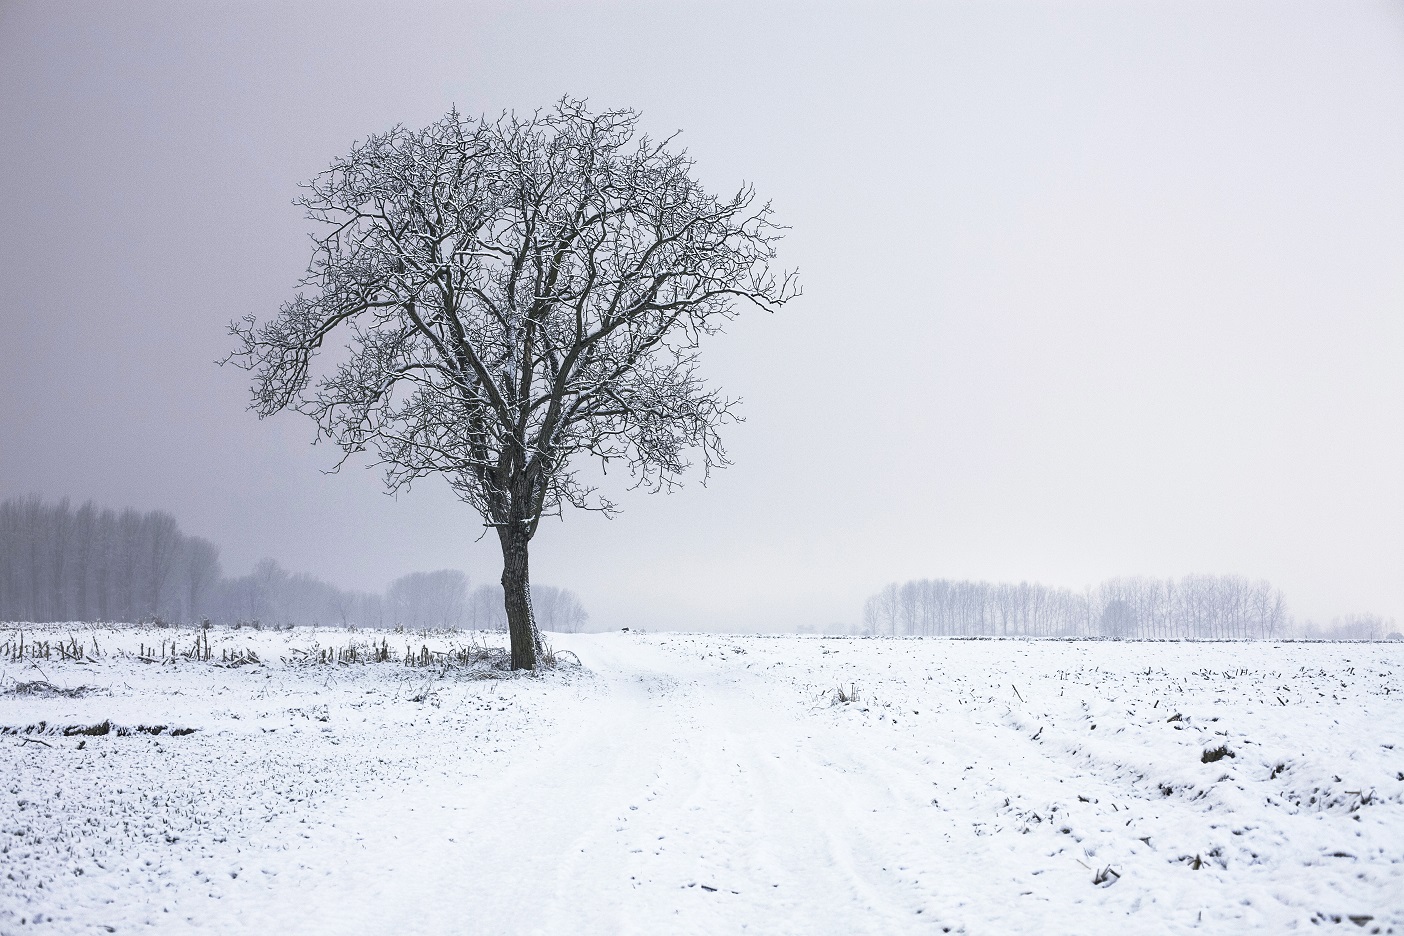
On October 22, parts of Northeastern Pennsylvania received their first snows of the season. Although this event was isolated to the highest elevations, it is Nature’s kind reminder that winter is around the corner. Earlier in the year, I wrote a post regarding my thoughts on this upcoming winter; today’s post serves as a follow up to my preliminary thoughts. So what are we waiting for? Let’s get started…
Sea Surface Temperatures — The Driver
One tool many meteorologists use to forecast a given season is to analyze sea surface temperature anomalies, or SSTs for short. We are looking for areas of water that are warmer or colder than average. From here, meteorologists determine how these areas of water impact the weather pattern. In addition, they take the current ocean state and try to find past years that are similar to this year. These are known as analogs and they are used to get an idea of what might be around the corner. I will be using this method for my winter forecast.
Step 1: Current Conditions
Just like the Local on the 8s, we must start with the current conditions in order to find suitable past years. Below is a sea surface temperature anomaly map for September 2016.
Step 2: Finding Past Years Similar to This Year
Next, we try to find past ocean conditions similar to the image above. But there is a slight problem: we have a unique and rare setup. If you notice in the image, the waters just south of Alaska are very warm while the waters in the Equatorial Pacific are cool (if this area was colder, it would be known as a La Nina). Typically, both of these areas would either be warm or cold at the same time; rarely are they in opposite states like today. This makes it difficult to identify potential analogs for the winter.
In an effort to select analogs, I took every year and correlated them to four areas of ocean: the North Atlantic, the West Coast of North America, the Equatorial Pacific, and the Northern Indian Ocean. The more areas of water a particular year matched, the higher weighting it received. After both computer and human analysis, I came up with the following analog package… (note: negative years represent the opposite sea state of that year; these are known as anti-logs).
2013-14 (3), 2014-15 (3), 1983-84 (2), -1965-66 (2), -1991-92 (1), -1968-69 (1). If you have any questions regarding why I used certain years, feel free to contact me (social media preferred). The resulting ocean setup is below.
The analog package SST setup is very close to what I expect for the heart of winter. It is not a perfect match, but it is as close as I could get it. To determine if the analog package is usable, let us compare October 2016 global temperatures to our blend of years.
Here is what October 2016 should look like according to our analogs.
Here is where what October temperature anomalies look like year-to-date. You can see how the analog package has similarities to current North America, Arctic, Siberia, Eastern Greenland, and China anomalies. This is a good sign; our analog package has validity.
Step 3: What Does The Analog Package Hint About Winter?
I will let the images speak for themselves. Below is the analog blend’s temperature anomaly “forecast” for the upcoming winter month-by-month… (note: preliminary forecasts for November and December seem to match the analog package forecast)
November:
December:
January:
February:
March:
Yikes, that is cold…
Given the analog package is matching October observations (potentially November and December forecasts too) and because certain cold signals will likely be more influential than warm signals, I do believe this analog package will verify and is therefore my forecast for the upcoming winter: below normal temperatures and above normal snowfall.
School Closing Forecast for Northeastern Pennsylvania:
Delays: 7-9
Closings: 7-10
Early Dismissals: 2-4
No Activities Only: 1-3
A Few Side Notes:
— I believe the 2013-14 winter is the best match to this year (ocean setup below as a comparison to this year). That winter was remarkable, cold, and brutal.
— Some reputable meteorologists are looking into the 1995-96 winter as an analog to this year. However, I did not include it in my forecast because the North Atlantic Ocean does not match 95-96.
— A white Thanksgiving and Christmas could be on the table. Unlike the past few years where December was blow-torch warm without snow, this year has the potential to feature snow cover during the major early-winter holidays. Below is the precipitation anomaly map from November through December according to the analog package; it is suggesting above average snowfall during this time period.
If you have any questions or commentary regarding my forecast, please do not hesitate to reach out to me via social media. Thank you very much for the support and have a good day!


